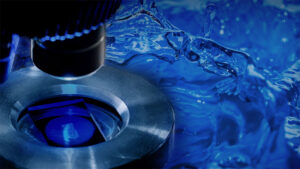
Interface Fluidics use of imaging sets us apart from other reservoir-fluid testing companies. This arsenal of physical and digital systems opens a window to how fluids behave at the pore scale – providing phase behaviour information critical to building computer reservoir models.
Interface’s fluid-fluid compatibility studies are conducted using reservoir-mimicking microfluidic chips, under powerful digital microscopes. Image results captured are then processed through computer vision to quantify chemical performance. In doing so, we measure a chemical’s ability to increase yield or create damage.
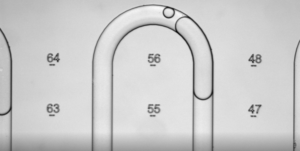
Images taken of the pore scale tell a much more nuanced story than blind bulk-scale testing. By visualizing fluid interactions in micro and nano pores and throats, we provide insights into the mechanisms behind chemical performance that conventional tests, such as core floods, miss.
Even with X-ray technology, core floods only look at the sub-cm scale – multiple orders of magnitude short of Interface’s sub-nm access. This means there is a wealth of information it’s missing out on.
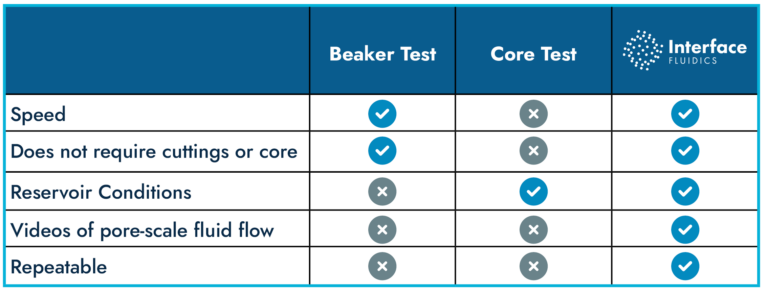
Interface provides a glimpse into the finer points of fluid flow in a reservoir – helping operators make better decisions in the field – while benefiting from faster results and better-quality data.
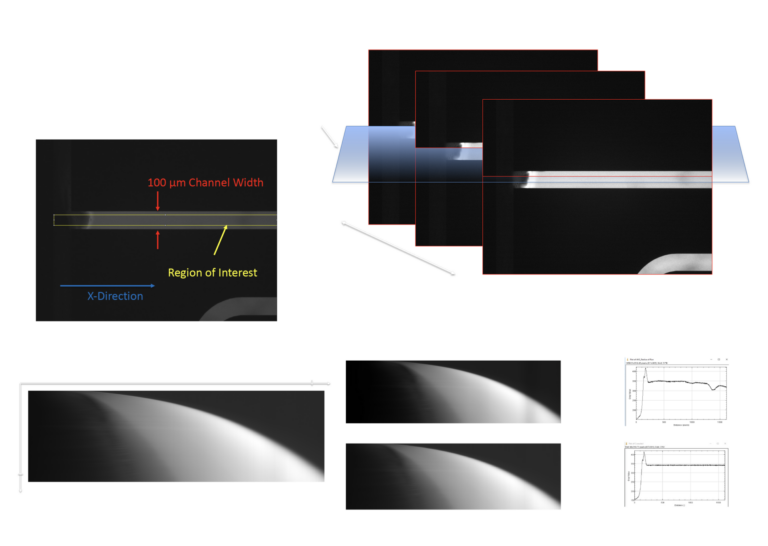
Interface can leverage high-resolution high-bit-depth systems to convert this light intensity into actionable data. Determining chemical concentration is an example, which is handy for running polymer-flooding tests or determining solvent concentration in SAGD chips.
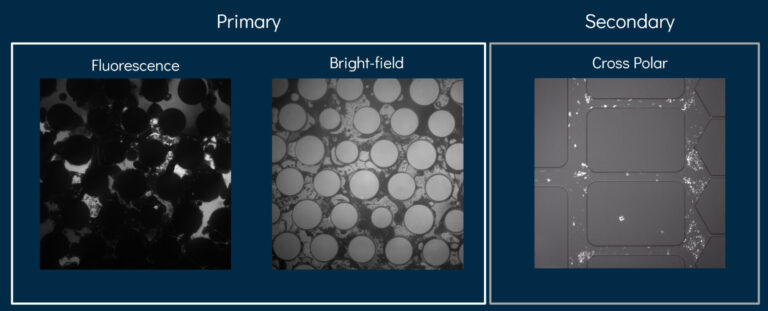
Bright-field microscopy, for example, distinguishes oil, water, air and solid components by their different light absorptions. It can be used to measure the contact angle and, combined with fluorescence, determine air and water locations in a chip.
In a more practical example, for carbon capture and storage, brightfield is used to track the location of the CO2 phase, while fluorescence is used to quantify the dynamics of salt precipitation. Similarly, cross-polar light can be used to measure wax appearance because when it is shined on wax particles, they appear brighter than the background.
The fourth type of imaging we use is infrared – which reveals local temperature environments that may affect chemical actions, such as the steam chamber in a SAGD chip.
Turning images into data
Generally, in a test image, the intensity of the hydrocarbon’s fluorescence determines the pixel value of that particular part of the image. Once we have the images, what we do with them is contextual to the test we’re running. The first step is often to preprocess or “clean” the image.
After preprocessing, thresholding takes place. Here we set a pixel value that separates the fluorescing oil from the dark background. So, the greyscale image can be converted to a binary one. Finally, we measure performance using variables like change in oil volume and displacement efficiency.
This data represents how images change as the experiment is run through plots, tables, and graphs. For example, take Regain Conductivity. Here we’re interested in conductivity values before and after a treatment is applied to compare the performance of different chemicals.
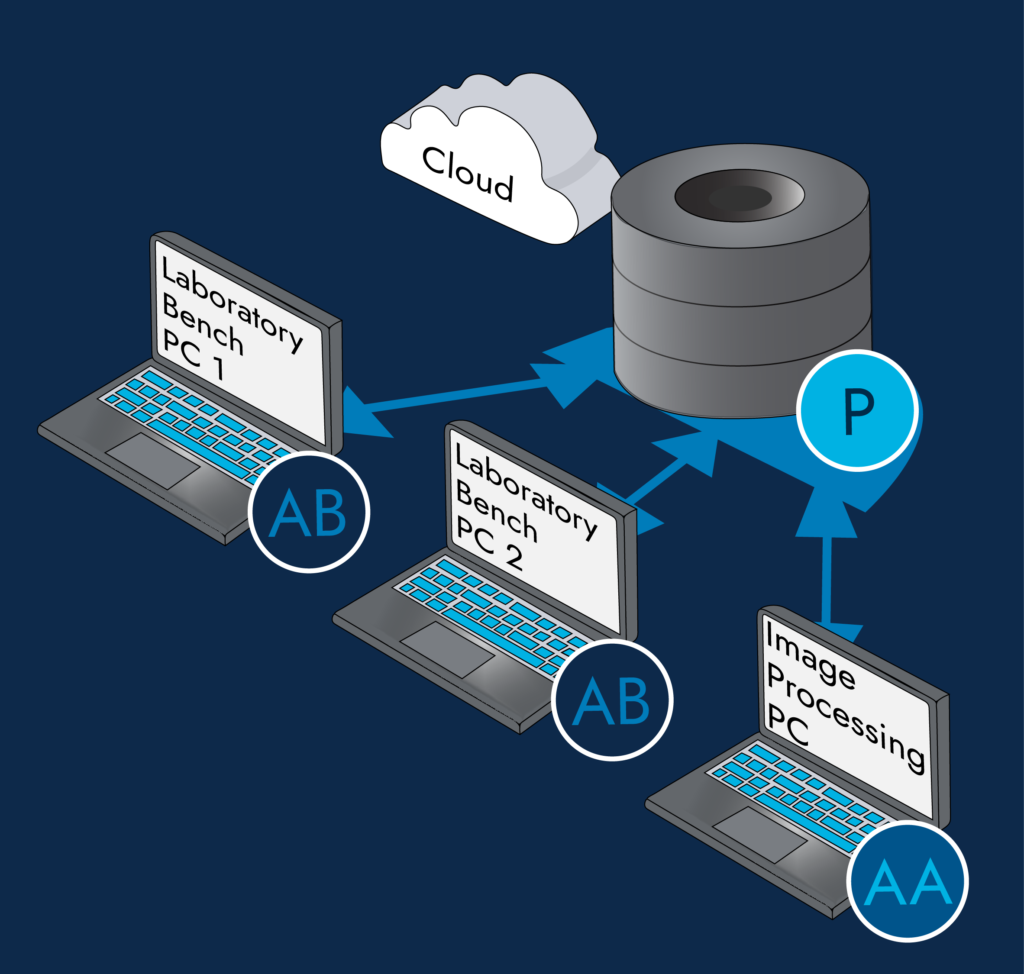
At Interface, image analysis takes place primarily through python-based Autoanalysis – an image processing system we created focused on extracting data from microfluidic images. In the image to the right, we see a typical set-up with Autoanalysis (AA), Autobench (AB) and Portal ( ).
But some tests are not fully image based. Regain, for instance, relies more on pressure logs – which is where Autobench comes in. It provides the unified logging of sensor and equipment data, correlating those with images and uploading both to the database. Lab analysts can then select which data they want to include with the images they download.
Autobench developer Evan Farnsworth says, “Autobench isn’t meant to reinvent the wheel. Rather, it integrates products from various manufacturers, which may communicate differently, allowing for unified data accumulation. Each tire may be from a different company, but the vehicle drives smoothly.”
Image processing across different domains
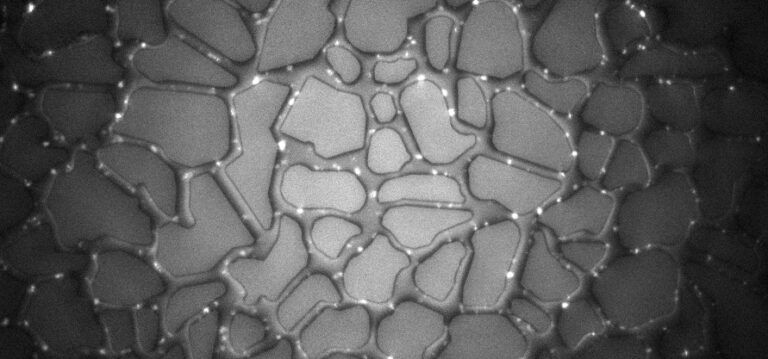
As mentioned earlier, wax appears as white crystals against a dark background in a wax test. Interface Senior Scientist Robin Arnason says, “In theory, detecting wax is not that different from detecting stars.”
When putting teams together, Interface sees the value in bringing expertise from different domains into oil and gas – to improve how the industry approaches testing. Mr. Arnason is a great example of such talent.
The Astronomy Ph.D. explains that counting wax crystals in a chip has the same principle as counting stars in a star field. But despite the similarities, in microfluidics, we’re more interested in the physical geometry of what we see.
If we want to know the change of wettability before and after we treat a chip with a chemical, we must measure the contact angle. This means we must find all boundaries between the two fluids, find a good spot, and physically measure an angle.
In other imaging applications like astronomy and biomedical microfluidics, you might not need to be as precise with these measurements. A human cell, for example, can range from 10-100 μm in diameter, while a shale pore in a flowback chip can be a thousand times smaller.
The fluids we’re capturing in these images can also exhibit complex behaviour. Senior Scientist Scott Pierobon says, “Our images give us a view of what’s going on, but also remind me of how much we’re missing down there. Like aerial snapshots of traffic in a fast-paced city, the fluids never sit still, always use the path less travelled, and can suddenly change direction at the slightest change in conditions.”
The evolution of imaging at Interface
Image stacks for a single Interface test can be around 100 Gigabytes. Overall, Interface generates similar data volumes to a mid-tier research telescope. Today, this data is automatically synced to a database.
On the image processing side, we replaced ImageJ, which is a Java-based program for processing high-resolution images. While it might do the job needed in biomedical applications, one big drawback of the software is that it doesn’t communicate with a database, so you’re married to an inefficient file-folder structure.
ImageJ is also not super extensible in adding custom models and scripting. It can do these, just not to the same level python can. Another challenge is in automating image processing methodology using it. So, we invented our own image processing program: Autoanalysis.
So, what does this mean for our oil and gas partners?
Autoanalysis is written in python – the benchmark for speed in programming. A big thing with this language is that you can parallelize code which is harder to do in Java. This multi-threading capacity adds:
- Speed: traditional testing is slow; the faster we are, the more value we add to our clients
- Cost: parallelizing code means using less hardware or doing more with available resources, which makes our systems more compact
- Efficiency: reduces the amount of time computer cores lay idle, maximizing their value
On top of that, Autoanalysis gives access to python’s image-processing libraries, which are very powerful, especially for automation. This software can potentially automate everything we do, all the way to creating a pdf report of the results. As Interface scales, automation becomes more and more important.
Automation adds value by increasing efficiency and speed. But the main advantage is that the more automated a test is, the more standardized and less subjective the measurement becomes. Core flooding, for example, is notoriously expert-dependent. As we expand, automation can also prevent workloads from ballooning out of control and help organize projects.
In short, Autoanalysis is faster, simpler to automate, can handle a bigger volume of data, and it’s easy to make it communicate with the database.
Imaging paves the way
Microfluidics, whether in the biomedical arena or energy, doesn’t happen without image processing and computer vision. As Interface continues to grow and through further deployments of the portable bench SapphireLab, our imaging capabilities will continue to increase.
Visual access to pore-scale dynamics of fluid interactions inside reservoirs provides unique insights to oil and gas companies. This is something reservoir engineers have only seen illustrations of in their textbooks. It can help them make better decisions in the field while benefiting from faster results and better-quality data.