Flow assurance in general, and wax deposition in particular, is a problem as old as the petroleum industry itself. It is estimated to cost around $330 billion per year when the impact of oil spills is considered. While there are a variety of ways to prevent and resolve this issue, there is still no one-size-fits-all solution.
In recent years, chemical treatment has garnered a lot of attention as it offers a host of advantages over other mitigation and remediation. However, chemicals are not always successful, can be costly, and aren’t equally effective with all types of oil. This is why experts recommend process-specific testing prior to their application.
Interface Fluidics does just that, through fast, affordable screening of chemistries like wax inhibitors, wax solvents, and many other compounds – as well as measuring the wax appearance temperature (WAT). Put together these form the ideal tool for oil and gas operators to address flow assurance problems.
How wax impacts our clients
Extracting waxy crude oil is both time-consuming and difficult. In fact, wax’s ability to cripple flow is well established in the literature – where it is found to be the main culprit behind production losses – affecting up to 85% of world reservoirs.
Wax rears its ugly head when temperature and pressure are reduced during oil flow. This causes the oil structure to destabilize, increasing its viscosity and resulting in wax precipitation in well tubulars and pipelines. As the temperature continues to drop, paraffin wax particles create a crystalline net that traps oil until it’s unable to flow.
This can cause problems like reduced production, increased power required to run pumps, equipment failure, oil spills, chocking of flowlines, and even premature well abandonment. Given these side effects, preventing wax deposition or removing it as soon as possible becomes a priority.
Thermal, mechanical, microbial, and chemical techniques have been developed to address this problem. Each of these comes with its set of advantages and disadvantages, are recommended for specific usage scenarios, and carry a different price tag.
At Interface, our focus (and a lot of focus for the past decade) is on chemical methods. This group of compounds brings benefits not found in other techniques. For example, using chemistry doesn’t interrupt production, is compatible with long-distance pipelines, and reduces restart pressure.
On top of that, chemicals successfully inhibit wax growth and facilitate its removal while favorably affecting the oil’s viscosity, pour point, and WAT.
But chemistry is a broad field that includes a range of compounds. Substances used include crystal modifiers, drag reducers, and nanoparticles for mitigation, and solvents and dispersants for removal. These can work on their own or in combination. At Interface, we can screen these combinations to find the optimal cocktail for each well.
Quite a few variables can impact how a chemical will perform, such as temperature, pressure, oil characteristics, type of compound, and its concentration. Process-specific testing, whether at the reservoir, well tubulars, or pipeline, is key to achieving the best results.
How microfluidics solves the wax problem
There are a number of reasons Interface recommends wax tests as a critical first step before applying chemical treatments. But our approach for testing reservoir fluids is unique in that it’s based on innovative microfluidics.
At its most basic level, microfluidics is the study and manipulation of fluids at the pico-to-micro liter scale. It’s a cutting-edge space, largely made possible by the advent of nanotechnology and high-resolution microscopy.
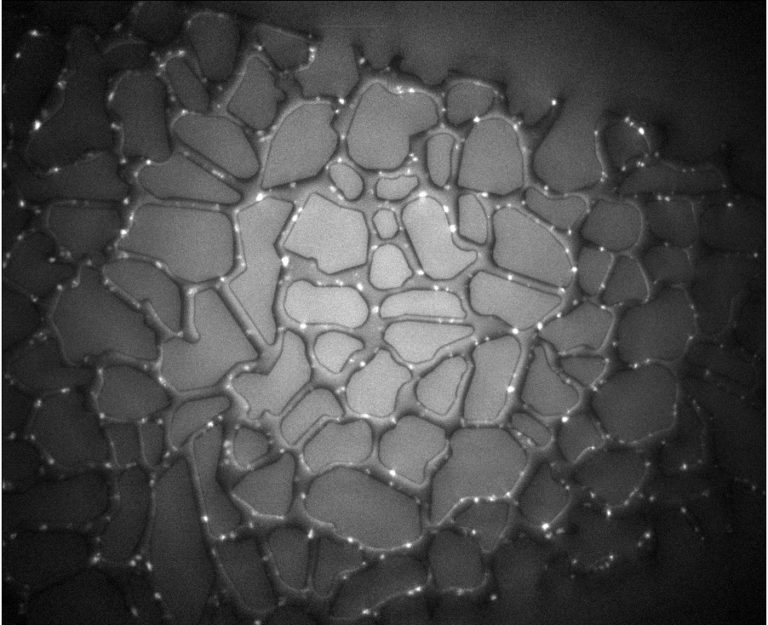
What powers our wax measurement is the fact that wax deposits appear brighter than the background under cross-polar light. Using computer vision, images like this one capture wax deposition over time. These images can then be turned into variables that describe performance, such as a chemical’s effect on wax particle size and number.
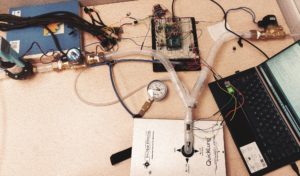
Our test starts by creating a representative microfluidic chip for the process we’re analyzing. For instance, we capture reservoir rock properties and geometry on our analogues. We also replicate reservoir pressure and temperature. Once samples of a client’s reservoir fluids are ready, the experiment can begin.
First, the chip is mounted on a custom manifold, which is raised to the starting temperature. Then, a few pore volumes of oil are injected into the chip. Next, the temperature is dropped by 1°C per minute, and then 0.2°C per minute as WAT is approached. The final step is measuring the wax crystals’ characteristics.
Advantages of this method include
- Using less than 0.1 mL of sample per data point
- Reducing measurement time to a few hours
- The versatility to screen a wide range of chemicals
- High sensitivity to even the smallest of wax particles
- Process-specific testing with visual results
Case studies in flow assurance
The versatility of Interface’s test is a big selling point for this technology. For example, Interface worked with an Alberta-based client who was experiencing wax-stabilized emulsions in production lines, causing issues for the separator.
The client had applied certain chemistry but costs were high, and mechanisms unclear. Additionally, due to a lack of data, optimizing the chemical program proved challenging.
The project goal was for Interface to analyze different wax modifiers, investigate their mechanisms and compare their performance. We also characterized the emulsions and provided a workflow for chemical selection that can be scaled and repeated.
In total, Interface conducted seven measurements – three for WAT and four for emulsion characterization – using three different chemicals alone and in combination with each other. In the WAT tests, we looked at the chemical’s impact on wax appearance temperature, deposition, and growth. For emulsion characterizations, the size and number of emulsions, and flow characteristics were examined.
The wax test began by increasing the temperature to 80°C and then slowly dropping it to around 20°C. The video seen here shows that the control run (without chemistry) had the largest amount of wax deposited and the highest degree of wax growth.
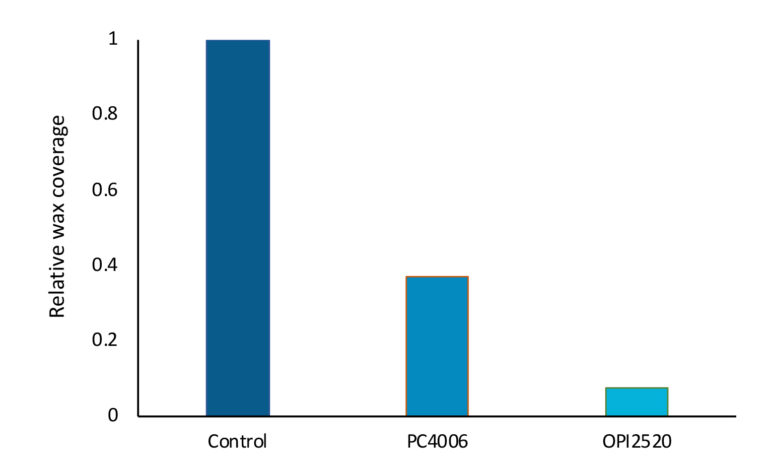
Chemical 2 showed the smallest amount of wax and the highest percentage of WAT reduction. Both Chemicals 1 and 2 successfully prevented wax agglomeration and so had predominantly small wax particles, as seen in the figure above.
On the emulsion side, the control produced many small emulsions which were very stable and hard to separate. When Chemical A was applied, slug flow was observed with minimal emulsions. The droplet size also increased, which makes the separation process easier. The same effect was observed with Chemical C, although it had more small emulsions.
Next-generation testing is now
Some clients come to Interface to find the WAT or how chemicals will affect it. Others are more interested in wax removal using solvents or a combination of chemistries. They can be encountering problems in the reservoir, well tubulars, or the pipeline. Still others might be dealing with wax-stabilized emulsions at the separator.
Interface Fluidics offers a versatile platform capable of delivering large volumes of data at a fraction of the cost, measurement time, and sample size – with the option to test in-house or on-site.
Find out more about Interface’s wax screening from our webinar.